Posts from October 2011 (39)

October 4, 2011

Brain scans don’t make it true.

The New York Times has an op-ed piece titled “You love your iPhone. Literally”.  The author claims that fMRI imaging of the brains of iPhone owners showed `The subjects’ brains responded to the sound of their phones as they would respond to the presence or proximity of a girlfriend, boyfriend or family member’.  This sounds, um, difficult to believe and invites the classic Tui ad response: “Yeah, right”. But it’s based on shiny high-tech neuroimaging, so it must be true.

There’s a good summary at BoingBoing and another at Prefrontal.org of the problems: the simplest one is that this particular area of the brain lights up for all sorts of things. Seeing activation of the insula is only  slightly more surprising than seeing the All Blacks win a rugby game.

While you’re at Prefrontal.org, make sure to look at their all-time classic “Neural correlates of interspecies perspective-taking in the post-mortem Atlantic Salmon“, where they demonstrate that some standard fMRI statistical procedures let them find emotional responses to photographs in 3.8lbs of Atlantic salmon from the local supermarket.
October 3, 2011

Fishing, the moon and statistics …

This is veteran fishing writer  Geoff Thomas in the Herald on Sunday:

“The question often arises: does the Maori fishing calendar work?

“To obtain a definitive answer one would have to ask the fish, but as this approach is not likely to achieve much it is more useful to look at a study by a university student [Ben Stevenson, of the Department of Statistics] who tried to reach a conclusion in his thesis.”

Read more here

Emigration graphics

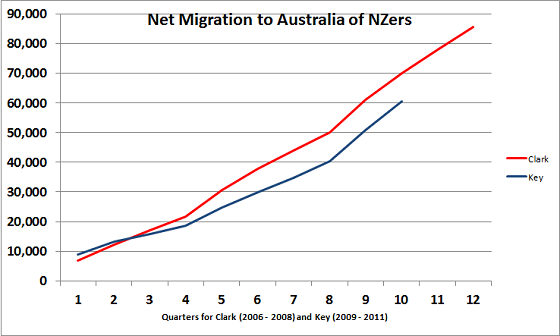
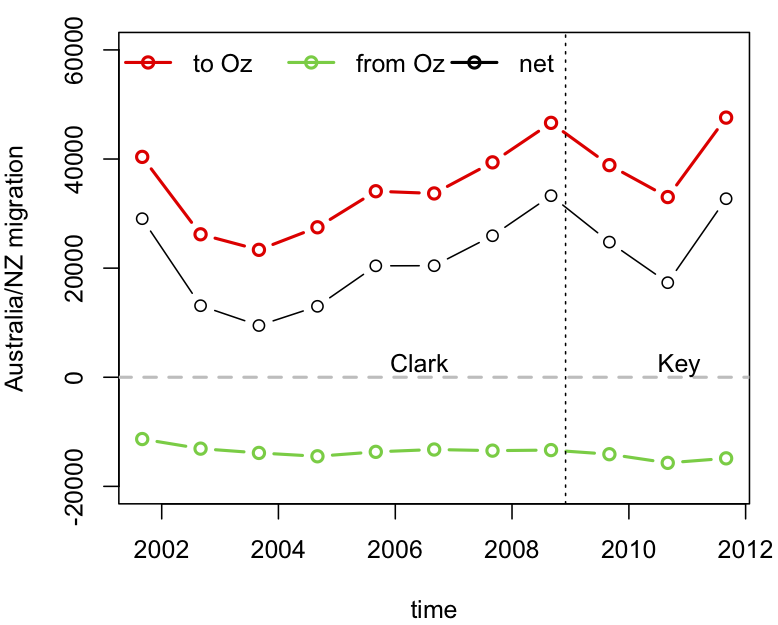
The big problem with our stat-of-the-week was the graphics.  While David Farrar’s redesign to add the early years of Helen Clark’s government provides some context, a cumulative graph is not a good way to see changes over time.   For anyone who actually wants to see the immigration/emigration rates over time, rather than just making a political point, here is a non-cumulative graph using data I downloaded from Stats New Zealand.  The dots are totals for the 12 months ending August each year (the most up-to-date values available).

Disaggregating immigration and emigration is helpful here: immigration from Australia has been roughly constant, but emigration to Australia fluctuates a lot, on top of a weak upwards trend.

“Unexpected results of a new poll”?

Kiwiblog’s David Farrar has nominated 3 News for the most misleading story of the week in their reporting of a political poll because their story does not mention that the poll was only a sample of Maori voters, not a sample of all voters:

“Labour most popular party in new poll…

Labour leader Phil Goff will be clinging to the unexpected results of a new poll in which his party has picked up twice as much support as National.

But he is well behind John Key in the preferred prime minister stakes, according to the TVNZ Marae Investigates Digipoll, released today.

Labour’s on 38.4 percent support in the poll, followed by the Maori Party on 22.2 percent, while National’s on just 16.4 percent. That is in stark contrast to other media polls, which put National above 50 percent support, with Labour rating at 30 percent or less, and the Maori Party on around one percent support.

…The TVNZ poll interviewed 1002 respondents between August 19 and September 20, and has a margin of error of +/- 3.1 percent.”

The original press release from TVNZ does state this very clearly:

Full release of Digipoll Maori Voter Survey… The TVNZ Marae Investigates Digipoll is one the most established voter polls in NZ and often the only one to survey Maori voters in an election year.

In a further 3 News article they discuss a different poll and say that “the poll differs greatly to one released by TVNZ’s Marae Investigates earlier today” without explanation for the difference.

UPDATE: 3 News have now updated the headline to: “Labour most popular party among Maori” and added “The TVNZ Marae Investigates Digipoll surveyed Maori listed on both the general and Maori electoral rolls.”

3 News’ Chief Editor James Murray apologised on Kiwiblog:

“Got to put our hands up to a genuine mistake there. This was a story from our wire service, and we didn’t do our due diligence in fact-checking it.

We absolutely understand the importance of getting this right, and the story has now been corrected. My team have been told to be extra vigilant on poll stories in future and NZN have been informed of the error.

Apologies for anyone who may have been misled by this mistake.”

Stat of the Week Winner: September 24-30 2011

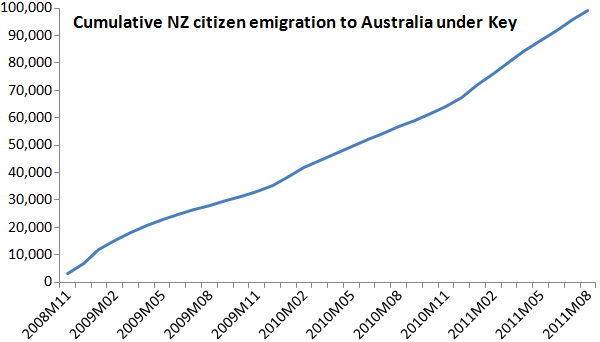
This week we’ve chosen Jeremy Greenbrook-Held’s nomination of this graph found on political blog The Standard:

Many have been criticising the graph, including David Farrar, those in the comments on The Standard and a blog post on Stuff, and here’s a summary of the main concerns:

  1. Using cumulative figures, making it appear as though the rate of emigration is increasing.
  2. Starting the graph at zero makes it appear as though no-one emigrated prior to John Key becoming Prime Minister.
  3. The graph uses gross migration rather than net migration
  4. Not displaying historial emigration data for comparison

David Farrar created a graph which addresses points 3 and 4 above:

Stat of the Week Competition: October 1-7 2011

Each week, we would like to invite readers of Stats Chat to submit nominations for our Stat of the Week competition and be in with the chance to win an iTunes voucher.

Here’s how it works:

  • Anyone may add a comment on this post to nominate their Stat of the Week candidate before midday Friday October 7 2011.
  • Statistics can be bad, exemplary or fascinating.
  • The statistic must be in the NZ media during the period of October 1-7 2011 inclusive.
  • Quote the statistic, when and where it was published and tell us why it should be our Stat of the Week.

Next Monday at midday we’ll announce the winner of this week’s Stat of the Week competition, and start a new one.

The fine print:

  • Judging will be conducted by the blog moderator in liaison with staff at the Department of Statistics, The University of Auckland.
  • The judges’ decision will be final.
  • The judges can decide not to award a prize if they do not believe a suitable statistic has been posted in the preceeding week.
  • Only the first nomination of any individual example of a statistic used in the NZ media will qualify for the competition.
  • Employees (other than student employees) of the Statistics department at the University of Auckland are not eligible to win.
  • The person posting the winning entry will receive a $20 iTunes voucher.
  • The blog moderator will contact the winner via their notified email address and advise the details of the $20 iTunes voucher to that same email address.
  • The competition will commence Monday 8 August 2011 and continue until cancellation is notified on the blog.

Noted for the record

One of the reasons statistics is difficult is the ‘availability heuristic’. That is, we estimate probabilities based on things we can remember, and it’s a lot easier to remember dramatic events than boring ones.  It’s not just that correlation doesn’t imply causation; our perception of correlation doesn’t even imply correlation.

To help with availability, I’d like to make two boring and predictable observations about recent events.

1.  This winter, despite the Icy Polar Blast™, was slightly warmer than the historical average, as forecast.

2. There wasn’t a major earthquake in ChCh in the last week of September, despite the position of the moon or the alignment of Uranus (or anything else round and irrelevant).

Stat of the Week Nominations: October 1-7 2011

If you’d like to comment on or debate any of this week’s Stat of the Week nominations, please do so below!

October 2, 2011

Watch out, England: Aussie RWC prediction

Today’s Sunday  Star-Times has a story on page 5 suggesting that England should brace themselves for grand-final defeat.

An Aussie-based New Zealand statistics expert, Stefan Yelas, research director at Beaton Research & Consulting, is backing the All Blacks to beat Argentina and the Springboks on their road to the world cup final, where, he says, they will hammer England by 23 points.

Read the full story here …