Extreme weather
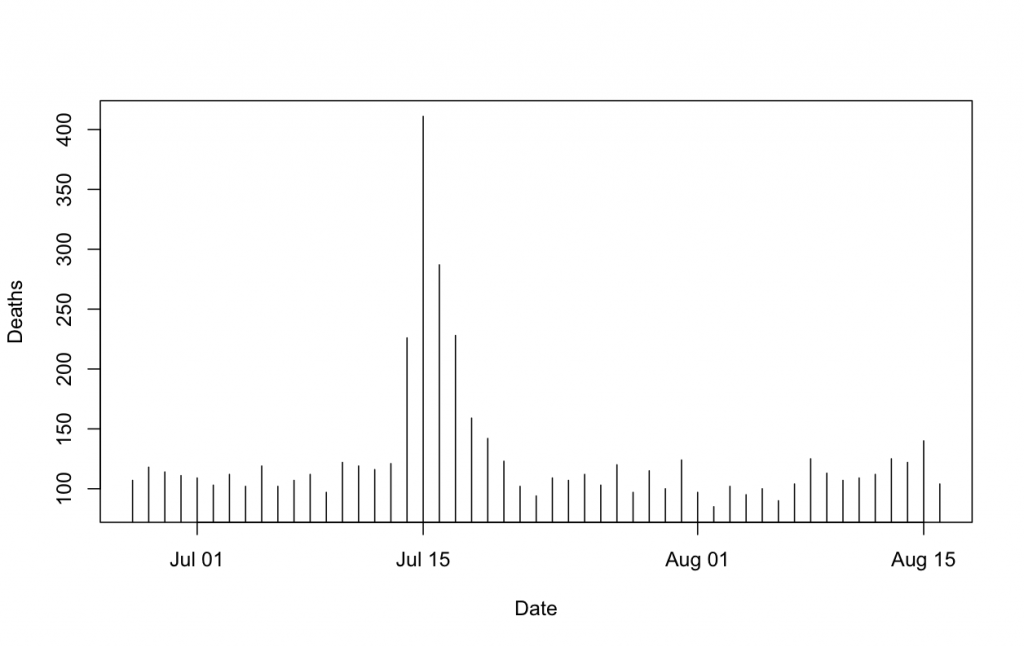
No, not last week’s snow. To paraphrase Crocodile Dundee: “That’s not an extreme weather event! This is an extreme weather event.” The graph below shows daily deaths in Chicago, over a fourteen year period. Do you notice anything?
Chicago has predominantly bad weather, with temperatures colder than your freezer in winter, and sauna-level heat and humidity in summer [I’m told there is a brief period in autumn that can be quite pleasant]. The spike in the graph, which represents about 750 extra deaths over a few days, is the Great Chicago Heat Wave of 1995. The temperature, on its own, wasn’t that impressive, staying below 40C, but the humidity was also very high. This graph shows the effective temperature, calculated using a Canadian formula.
 The bars in this plot go up or down from 37, ie, body temperature. For comparison, a typical sticky Auckland summer day with a temperature of 23C and dewpoint of 19C would have an effective temperature around 30. The Chicago heat wave wasn’t that much hotter than typical summer peaks, but combined with the lack of wind, and air conditioning handicapped by power failures it was enough to make the difference between ‘unpleasant’ and ‘lethal’ for hundreds of people. While the old and sick are most susceptible to this kind of stress, the extra deaths weren’t followed by a dip in mortality, showing that it wasn’t just people near death who were carried off by the weather.
So, why is this relevant to us? Firstly, it’s another example of interesting data conveniently available on the web. Researchers at Johns Hopkins University compiled a huge set of temperature, pollution and health data for studies of air pollution effects, and they have gone to a lot of effort to make the data accessible, and reusable by anyone. Secondly, the Chicago heat wave shows that many people in the world, not just those in tropical areas, live close to the safety limits for weather, given their buildings, way of life, and acclimatization. The same sort of thing happens elsewhere, such as in France in 2003. An increase in temperature by only a few degrees can have a big impact. The relevance of this to current political issues is left as an exercise for the reader.
Thomas Lumley (@tslumley) is Professor of Biostatistics at the University of Auckland. His research interests include semiparametric models, survey sampling, statistical computing, foundations of statistics, and whatever methodological problems his medical collaborators come up with. He also blogs at Biased and Inefficient See all posts by Thomas Lumley »
