Search results for lotto (43)

January 19, 2014

How to beat Lotto

That is, how to gamble in a way that over a course of a year, gives you a higher chance at a larger payout than playing NZ Lotto each week and hoping for Division 1. We all know you can’t “beat Lotto” in the usual sense of improving your odds of winning.

In the ordinary Saturday Lotto, you pick 6 numbers out of 40, and if all 6 are correct (which they aren’t) you win $1 million. The chance of winning is 1 in 3838380 per ‘line’. Suppose you play the minimum of 4 lines, for $6, each week for a year. The chance of winning in a year is one in 18453.75. That is, on average you’d expect to win once in every 18453 years and 9 months.

Alternatively, suppose you save up the $6 per week, and then at the end of the year go to a casino and play roulette.  Put it all on a single number.  If you win, put it all on a single number again, and then if you win,  put it all on a ‘double street’ of six numbers.  Your chance of winning (in double-zero roulette) is 1 in 9145.33, and if you win you will make $2426112.

So, you get twice the chance of winning as you would have for Lotto division 1, and more than twice the payout. The expected return is 85%, much better than the 56% that NZ Lotteries returns (averaged over all its games, annual report).  Does that mean it’s a good idea? No. Not even slightly.  You have a 37 in 38 chance of turning up with $300 and losing it in a few minutes. If you don’t, you have a 37 in 38 chance of losing $7500 in the next few minutes, and if you don’t, you have about an 85% chance of losing more than quarter of a million dollars.   This strategy makes your losses obvious, which makes gambling no fun. And you still only win once every 91 centuries.

Enjoyable gambling, including Lotto, is based on making your losses less obvious by masking them with small wins and stretching them out over time. Of course, that’s also what makes gambling, including Lotto, potentially addictive.

January 14, 2014

Causation, counterfactuals, and Lotto

A story in the Herald illustrates a subtle technical and philosophical point about causation. One of Saturday’s Lotto winners says

“I realised I was starving, so stopped to grab a bacon and egg sandwich.

“When I saw they had a Lotto kiosk, I decided to buy our Lotto tickets while I was there.

“We usually buy our tickets at the supermarket, so I’m glad I followed my gut on this one,” said one of the couple, who wish to remain anonymous.

Assuming it was a random pick, it’s almost certainly true that if they had not bought the ticket at that Lotto kiosk at that time, they would not have won.  On the other hand, if Lotto is honest, buying at that kiosk wasn’t a good strategy — it had no impact on the chance of winning.

There is a sense in which buying the bacon-and-egg sandwich was a cause of the win, but it’s not a very useful sense of the word ’cause’ for most statistical purposes.

January 14, 2013

More about Lotto numbers …

From today’s New Zealand Herald:

Five Lotto numbers prove very lucky

Two Saturdays in a row, five of the same numbers were drawn in Lotto.

But a statistician says the chances of that happening aren’t as high as they may seem – 1 in 5500 ….

Said statistician is our very own Russell Millar. The rest of the story is here


September 5, 2012

Lotto and abstract theory

There is a recurring argument in statistics departments around the world about how much abstract theory should be taught to students, and how much actual applied statistics. One of the arguments in favour of theory, even for students who are being trained to do applied data analysis, is that theory gives you a way to substitute calculation for thought. Thinking is hard, so we try to save it for problems where it is needed.

The current top Google hit for “big wednesday statistics” offers a nice illustration.  It’s a website selling strategies to increase your chance of winning, based on a simple message

If you play a pattern that occurs only five percent of the time, you can expect that pattern to lose 95 percent of the time, giving you no chance to win 95 percent of the time. So, don’t buck the probabilities.

For example,

When you select your lotto numbers, try to have a relatively even mix of odd and even numbers. All odd numbers or all even numbers are rarely drawn, occurring only one percent of the time. The best mix is to have 2/4, 4/2 or 3/3, which means two odd and four even, or four odd and two even, or three odd and three even. One of these three patterns will occur in 83 percent of the drawings.

Now, if you understand how the lottery is drawn and know some basic probability, you can tell that this advice can’t possibly work, without even reading it carefully. But if you had to explain the fallacy to someone, it might take a bit of thought to locate it.  If 99% of wins are have a mixture of odd and even (actually, more like 98%), why doesn’t that make it bad to choose all odd or all even?

When you have an answer (or have given up), click through for more:

(more…)

How to win Lotto … sort of

From today’s Herald …

Choose carefully, $23m is at stake

Today’s $23 million Big Wednesday draw is the fourth-largest prize in Lotto history.

And while there is no secret way to guarantee hitting the jackpot, a mathematician says you can boost chances of not having to share any cash you do win.

Associate Professor of Statistics at the University of Auckland David Scott said: “There’s no way of increasing your chances of winning but it’s possible to increase your chances of getting more money and not having to share it.

“Avoid the numbers of 1 up to 30, where people choose their birthdays.”

Read the rest of the story here.


August 2, 2012

Is Lotto rigged?

Stuff seems to think so (via a Stat of the Week nomination)

If you plan to celebrate 25 years of Lotto with a ticket for tonight’s Big Wednesday draw, some outlets offer better odds than others.

No, they don’t.  They offer the same odds, roughly zero. Some outlets have sold more winning tickets than others in the past, that’s all.

Many people, even statisticians, enjoy playing Lotto. If you want to buy tickets at places where other people have won in the past, there’s nothing wrong with that and it won’t hurt your chances.   Since many people enjoy playing, it makes some sense for newspapers to write about Lotto from time to time.  But there’s no excuse for leading with a blatantly untrue statement.


March 30, 2012

Lotto silliness

As my good friend and colleague Thomas Lumley points out we have plenty of Lotto-based silliness to tide us over until the next stupid health related press release from a conference with no quality checks. Case-in-point is the article Powerball could be in the stars in Thursday’s NZ Herald (29 March, 2012, A5): (also nominated by Sammie Jia for Stat of the Week).

The article reports the frequency of zodiac signs from a survey of 104 first division Lotto winners, and gleefully touts Taurus as the luckiest star sign with 13% of the total. The article gives us a summary table:

Taurus 13%
Libra 11%
Capricorn 10%
Aquarius 9%
Virgo 9%
Pisces 9%
Leo 8%


Of course, all keen Statschat readers will note that this table does not add up to 100%, nor does it show all twelve zodiac signs, which is not very helpful. Buried in the text is the additional information that Aries and Cancer combined make up 4% of the total.

If we spread the remaining probability over Gemini, Sagittarius and Scorpio, and make the not entirely justified assumption that the distribution of zodiac signs is uniform (which is exactly what the NZ Herald has done), then we can perform a simple chi-squared test of uniformity. This yields a P-value of 0.22, which for most frequentists isn’t exactly compelling evidence.

Being a Bayesian, I prefer to assume multinomial sampling with the prior on the probability of success being uniform. The figure below shows posterior credible intervals (based on 10,000 samples) for the true probability of success. The red dots are the observed values. The dashed line is the equal probability line (0.083 = 1/12).


All of the intervals overlap confirming our statistical intuition that all we are really observing is sampling variation. Yes, Ares and Cancer do fall below the line, but they are not significantly different from the other signs. You can, of course, not believe me – in which case Thomas has some tickets from last week’s draw going very cheap and your chance of winning is almost the same.

September 17, 2022

Briefly

  • From Radio NZ’s series on the lotto: “When contacted by RNZ, Lotto said it would now no longer claim that there were lucky stores. “We recently carried out a piece of work looking at the use of the word ‘luck’ in relation to our products and as a result of this work have decided we will not in the future put ‘lucky stores’ or ‘lucky regions’ in press releases,” head of corporate communications Lucy Fullarton said.”.  As StatsChat readers will remember, we’ve been attacking this use of “lucky” for a while.
  • On the other hand, Lotto doesn’t need to specifically make these claims any more, since they’re already  well known. For example, see today’s Herald, “Kiwis are rushing into lucky Lotto stores ahead of tonight’s $20 million jackpot draw”, naming the same Hastings pharmacy as the Radio NZ story did.
  • Good article by Jamie Morton in the Herald on interesting clinical trials in New Zealand.
  • The UK Office of National Statistics has a life expectancy calculator — if, to pick an example almost at random, you wanted to find out how long a 73-year old man would be expected to live
  • There’s a claim out there that the median book only sells twelve copies.  As you’d expect, it’s more complicated than that
December 31, 2021

Top non-rugby posts of the year

(The rugby prediction posts, while popular, are most interesting before the games actually happen: predicting the past is relatively easy)

First, the posts, regardless of year of writing, with most 2021 hits

  1.  What’s a Group 1 Carcinogen? (2013) Points out that the IARC classification is not about severity or danger but about the types and amounts of evidence. Sunlight is a Group 1 Carcinogen, so are alcohol and plutonium.
  2. A post about a Lotto strategy that doesn’t work(2012), as an argument about the usefulness of abstract theory. See also, the martingale optional stopping theorem
  3. A climate change post about graphs that shouldn’t have a zero on the y-axis(2015)
  4. From October 2020, but relevant to the news again in March this year, on crime rates in the Cuba/Courtenay area of Wellington and denominators
  5. Actually from July this year, one of the StatsChat Dialogues: Q: Did you see that learning maths can affect your brain? A: Well, yes. There wouldn’t be much point otherwise

And the top 2021-vintage posts

  1. Number 5 from the previous list
  2. From October, on interpreting vaccination percentages
  3. From April, why there’s so much fuss about very rare adverse reactions to vaccines (the AZ blood clots)
  4. From October, why population structure matters to epidemic control, aka, why we need to vaccinate every subgroup. Has pictures!
  5. From June, how a cap-and-trade system for (a subset of) emissions messes up our intuition about other climate interventions.

These are WordPress page views: their relationship to actual readership is complicated; keep in a cool, dry place away from children; may contain nuts.

May 7, 2021

Mind if we call you ‘Bruce’?

From news.com.au (via @LewSOS and @Economissive on Twitter) “The names of Australians most likely to win the lotto have been revealed, with the top three taking home more than a quarter of the prizes last year.”

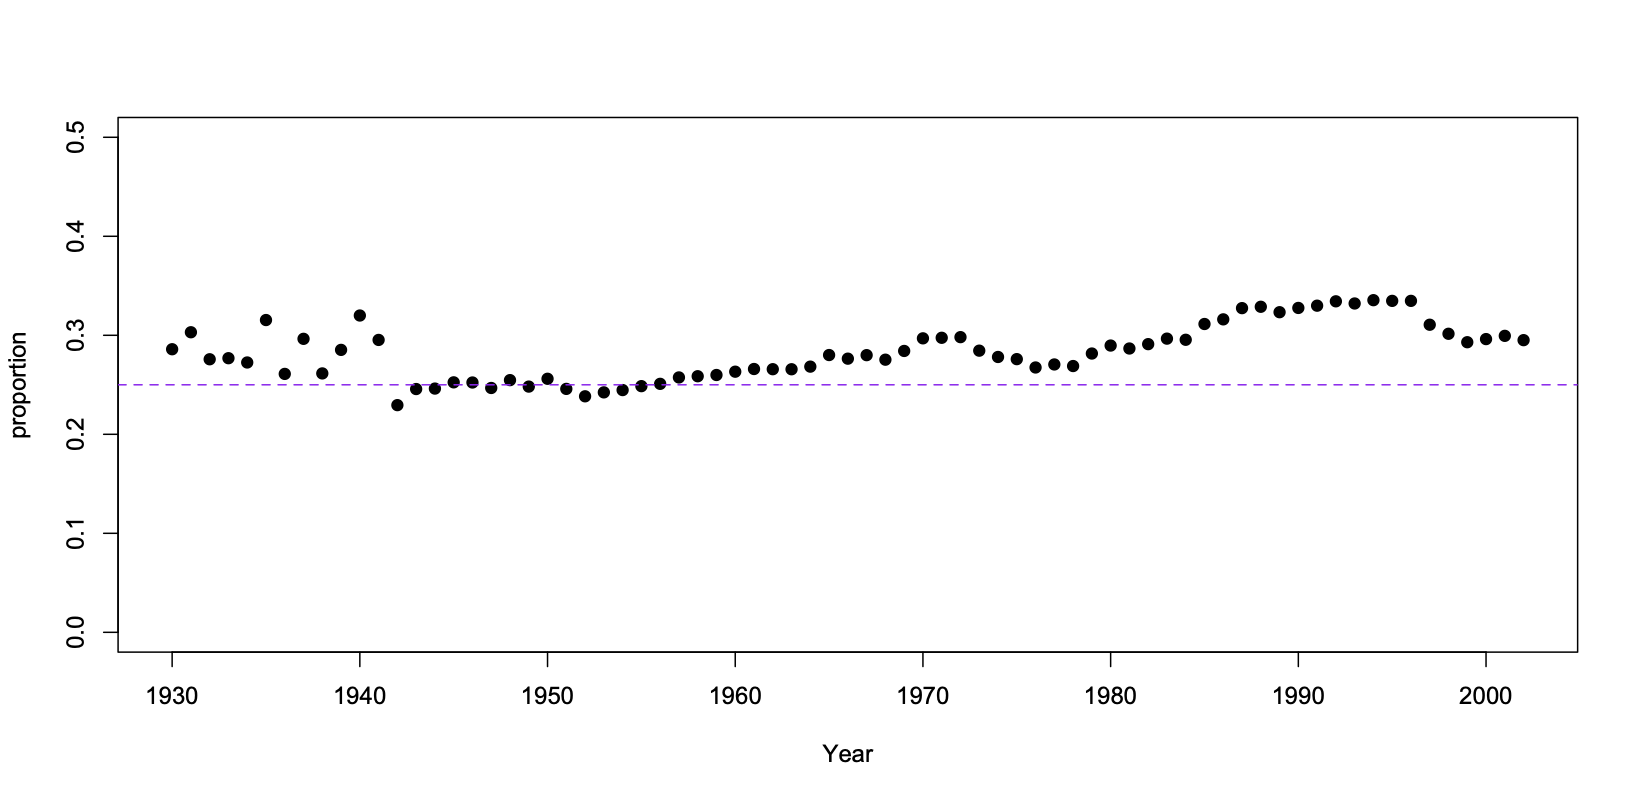
What they actually have for ‘names’ is first initials. Apparently, more than a quarter of first-division prizes last year were won by people whose names started with “J”, “A”, or “D”.  Of course, people whose names start with these letters are not any more likely to win lotto if they buy tickets. Either more people in this category bought tickets than average (in which case it would be truer to say they are more likely to lose Lotto), or the distribution of initials is pretty much the same as for the country as a whole.

The story does go on to say that name and age can’t affect your chance of winning, but not to explain why, given that, it’s news.

Anyway, since Rob Hyndman and the stats group at Monash have put together a database of frequencies of Australian names, we can see how representative the winners are.  Here are the proportion of Oz babies born each year (up to current 18-year-olds) whose names begin with “J”, “A”, or “D”. As you can see, it’s “more than a quarter” almost every year where we have data.

Since you’re a StatsChat reader, you can probably think of reasons there might be a difference between Lotto name frequencies and baby name frequencies.  The baby names don’t include immigrants and do include emigrants.  There might be ethnic differences in propensity to play Lotto that happen to be correlated with first initial. There might be quite large chance differences because the lottery folks only looked at first-division winners, a very small (but random) sample of Lotto players. But it doesn’t look like we need to go there.