Is Roy Morgan weird?
There seems to be a view that the Roy Morgan political opinion poll is more variable than the others, even to the extent that newspapers are willing to say so, eg, Stuff on May 7
The National Party has taken a big hit in the latest Roy Morgan poll, shedding 6 points to 42.5 per cent in the volatile survey.
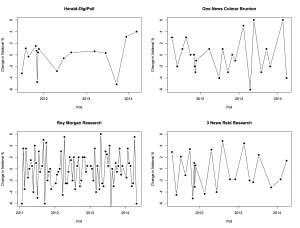
I was asked about this on Twitter this morning, so I went to get Peter Green’s data and aggregation model to see what it showed. In fact, there’s not much difference between the major polling companies in the variability of their estimates. Here, for example, are poll-to-poll changes in the support for National in successive polls for four companies
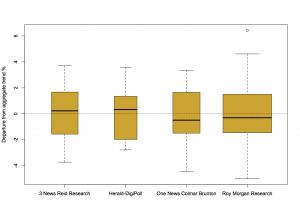
And here are their departures from the aggregated smooth trend
There really is not much to see here. So why do people feel that Roy Morgan comes out with strange results more often? Probably because Roy Morgan comes out with results more often.
For example, the proportion of poll-to-poll changes over 3 percentage points is 0.22 for One News/Colmar Brunton, 0.18 for Roy Morgan, and 0.23 for 3 News/Reid Research, all about the same, but the number of changes over 3 percentage points in this time frame is 5 for One News/Colmar Brunton, 14 for Roy Morgan, and 5 for 3 News/Reid Research.
There are more strange results from Roy Morgan than for the others, but it’s mostly for the same reason that there are more burglaries in Auckland than in the other New Zealand cities.
Thomas Lumley (@tslumley) is Professor of Biostatistics at the University of Auckland. His research interests include semiparametric models, survey sampling, statistical computing, foundations of statistics, and whatever methodological problems his medical collaborators come up with. He also blogs at Biased and Inefficient See all posts by Thomas Lumley »

